A utility tool is provided to analyze the difference between
two geometrical coordinates in two xyz files which store
Cartesian coordinates. The following three analyses are supported:
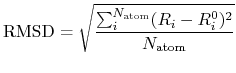
a root mean square of deviation (RMSD) between two Cartesian
coordinates defined by
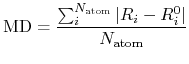
a mean deviation (MD) between two Cartesian coordinates defined by
and a mean deviation between bond lengths (MDBL) defined by
where  and
and  are the number of atoms
and the number of bonds with bond length (BL) within a cutoff radius.
Also, the deviation vector between xyz coordinate of
each atom is output to a xsf file 'dgeo_vec.xsf' in the XCrySDen
format. If you analyze the difference between two geometries,
this tool would be useful.
are the number of atoms
and the number of bonds with bond length (BL) within a cutoff radius.
Also, the deviation vector between xyz coordinate of
each atom is output to a xsf file 'dgeo_vec.xsf' in the XCrySDen
format. If you analyze the difference between two geometries,
this tool would be useful.
(1) Compiling of diff_gcube.c
There is a file 'diff_gcube.c' in the directory 'source'.
Compile the file as follows:
% gcc diff_geo.c -lm -o diff_geo
When the compile is completed normally, then you can find
an executable file 'diff_geo' in the directory 'source'.
Please copy the executable file to the directory 'work'.
(2) Calculation of the difference
You can find the following usage in the header part of diff_geo.c.
  usage:
  ./diff_geo file1.xyz file2.xyz -d rmsd

  option
  -d rmsd      a root mean square of deviation
  -d md        a mean deviation
  -d mdbl 2.2  a mean deviation between bond lengths,
  2.2 (Ang) means a cutoff bond length which
  can be taken into account in the calculation
If you want to know RMSD between two Cartesian coordinates, run as follows:
% ./diff_geo file1.xyz file2.xyz -d rmsd
The calculated result appears in the standard output (your display).
Also, a xsf file 'dgeo_vec.xsf' is generated in the XCrySDen format,
which stores the difference between Cartesian coordinates of each atom
in a vector form. This file can be visualized using
'Display Forces' in XCrySDen. When MDBL is calculated, please give
a cutoff bond length (Å). Bond lengths below the cutoff bond length
are taken into account for the RMSD calculation.
Figure 90 shows vectors corresponding to the deviation of atomic
coordinates in optimized structures and the difference of total charge
density between a neutral and one electron doped glycine molecule.
We see that the large structural change seems to take place together with the
large charge deviation.
This example illustrates that the tool would be useful when we want
to know how the structure is changed by the charge doping and the electric
field.
Forces' in XCrySDen. When MDBL is calculated, please give
a cutoff bond length (Å). Bond lengths below the cutoff bond length
are taken into account for the RMSD calculation.
Figure 90 shows vectors corresponding to the deviation of atomic
coordinates in optimized structures and the difference of total charge
density between a neutral and one electron doped glycine molecule.
We see that the large structural change seems to take place together with the
large charge deviation.
This example illustrates that the tool would be useful when we want
to know how the structure is changed by the charge doping and the electric
field.
Figure 90:
(a) Vectors corresponding to the deviation of atomic coordinates
in optimized structures and (b) the difference of total charge
density between a neutral and one electron doped glycine molecule.
These figures were visualized by XCrySDen.
In Fig. (b) blue and red colors indicate the decrease and increase
of total charge density, respectively.
|
|

![\includegraphics[width=14.0cm]{gly_diff.eps}](img615.png)